
Let's Convert A LabVIEW Project to LabVIEW NXG! (Part 2)
This is a continuation of a blog on converting a LabVIEW project to LabVIEW NXG. You can read Part 1 here.
Part 2 begins with the code largely ported and ready to test. After all that effort, does it work? Read on for the exciting conclusion!
It’s Alive! It’s Alive!
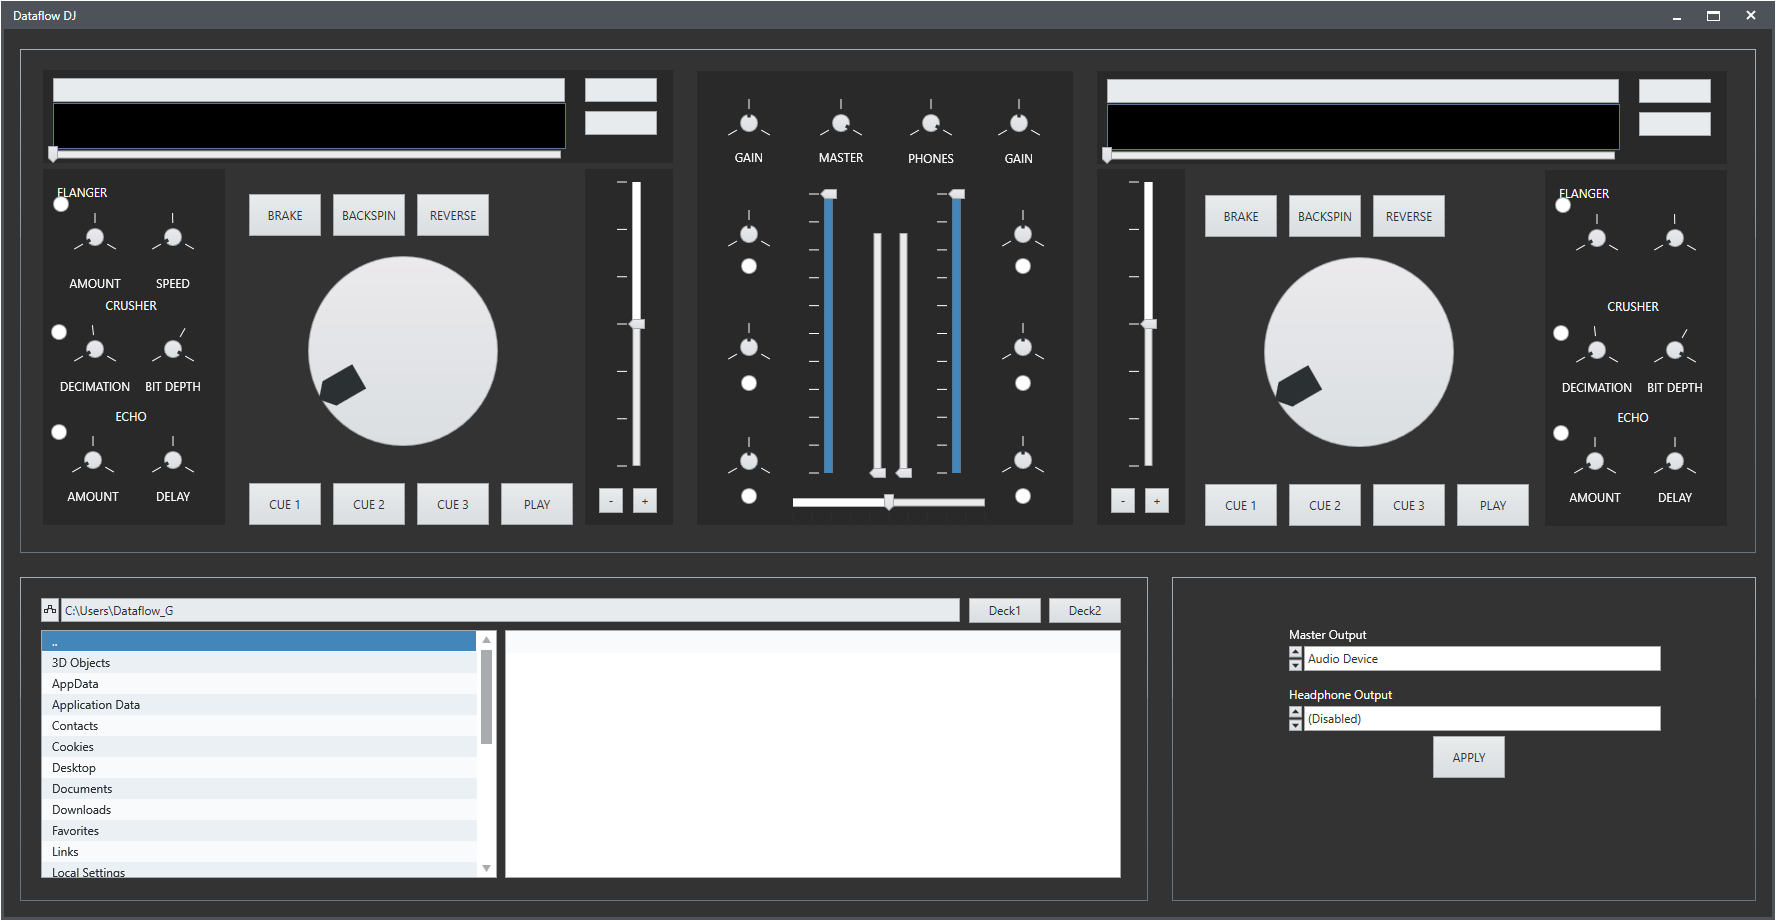
After much tinkering, UI tweaking, drag and drop workarounds, stripping out features, and fixing property bundle/unbundles, the moment finally arrived where the run arrow wasn’t broken any more. Pressing Ctrl+R and seeing each interface panel pop into existence was a little exciting! I honestly thought things wouldn’t get this far. It even bears a passing resemblance to the original interface.
 |
|---|
| Dataflow DJ running under NXG. |
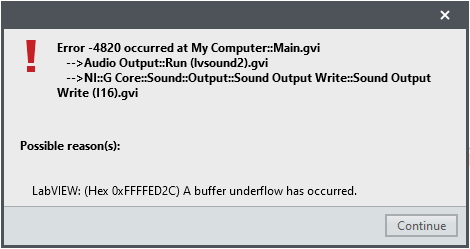
But does it actually work? I chose a track to load on Deck 1, the waveform appeared once it was ready, then hit play. And… it worked! Glitch-free playback, great! Now let’s load a second track, hit play and
 |
|---|
| Buffer underflow error from the sound device. |
Well, it’s a start.
Performance Bassline
“The most amazing achievement of the computer software industry is the continuing cancellation of the steady and staggering gains made by the computer hardware industry.”
- Henry Petroski
“Hold my beer.”
- LabVIEW NXG
It’s no secret that using LabVIEW NXG is slow. The minute long splash screen, the sluggish response to mouse clicks, even the dependency check NXG performs before the run arrow can be clicked. But what about run-time performance? How does it compare to LabVIEW?
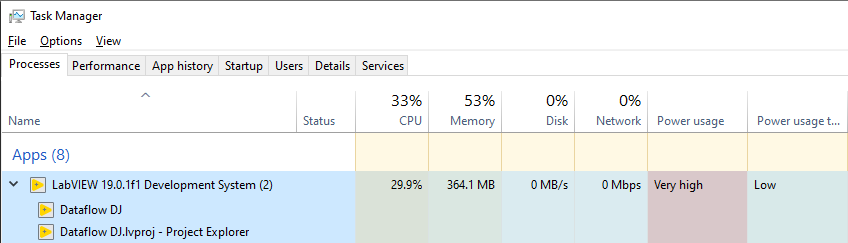
It would be useful to try quantify the performance difference with LabVIEW 20xx before attempting any optimization. As a quick baseline, here’s the CPU utilization of Dataflow DJ running under LabVIEW 2019, and under LabVIEW NXG 4.0. Both were run on the same Windows 10 virtual machine (though not at the same time). In both cases a single track is playing on deck 1 and no other audio effects active. Both are being run from the development environment, with debugging enabled on all VIs (where not inlined).
 |
|---|
| LabVIEW 2019 CPU is about 25%-30%. |
 |
|---|
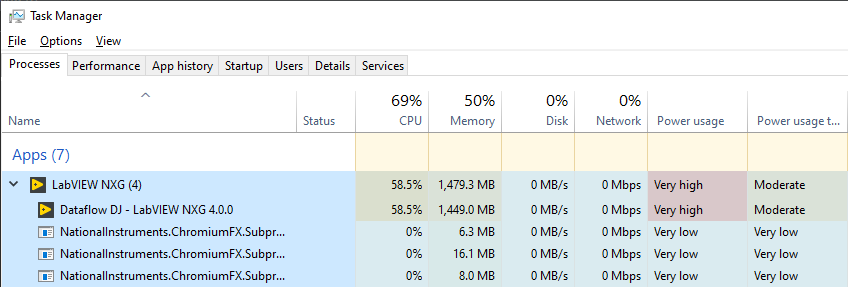
| LabVIEW NXG 4.0 CPU is about 60%. |
Running these tests in a VM isn’t great for performance - Dataflow DJ running as an exe in the host only uses 6-7% CPU, while running the same exe in the VM is about 25% CPU. But a doubling of the CPU utilization when using NXG was quite unexpected. And that RAM usage. Ouch.
Where is all that CPU time going exactly?
Performance Tweak 1 - UI Updates
The interface in Dataflow DJ isn’t typical of many LabVIEW applications, and has continuous rapid updates to multiple controls. These updates occur at a rate of output sample rate / buffer size, which in this case is 44100/1024, or 43Hz. This rate is in contrast to a typical process control or test system which might display updates at a leisurely 1Hz-5Hz. I had a hunch this is where the CPU usage was going in LabVIEW NXG.
To test this, writes were disabled to all controls in the UI update loop. The CPU usage was halved.
 |
|---|
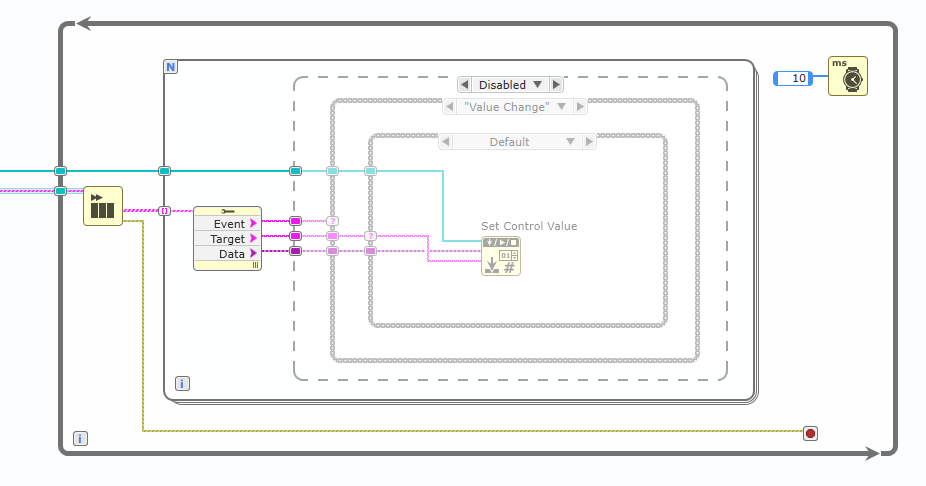
| This disabled code nets a 50% drop in CPU! |
You may recall in Part 1 of this blog that the control update method was changed in NXG from Value property writes to the Set Control Value method. Maybe this was to blame?
When a single deck is playing a track, there are five controls which are constantly updated - the jog wheel knob, playback position slider, time remaining string, and two level indicator sliders. To test potential performance overhead from Set Control Value, it was replaced with direct writes to each those control’s local variables duplicate terminals. In theory this should be the fastest way to update a control. After making the changes the application is run again, but the CPU was back up to 60%.
So it appears Set Control Value isn’t responsible for the big CPU jump. At this point it looks like it’s the actual control / front panel redraw which is so processor hungry.
If the update rate for that set of controls is reduced from 43Hz to a very choppy 5Hz, the CPU usage drops to around 40% for single deck playback. If playback is started on the second deck, there’s no longer an immediate buffer underflow. Unfortunately this hasn’t helped with the quality of the audio. As soon as the second deck starts playing, audio is a glitchy mess, and if left playing too long a buffer underflow eventually occurs.
Performance Tweak 2 - Audio Buffer
Another way to reduce CPU and achieve reasonable playback quality is to increase the audio buffer size. This means the CPU doesn’t have to work as hard to keep the output buffer filled, but has the knock on effect of increasing input lag. I wanted to avoid this if at all possible, as it’s not ideal for an application where reaction time is critical!
The sample buffer size was doubled from 1024 to 2048 samples, which dropped the CPU from 40% down to about 30% when playing one deck. Testing playback on the second deck starts out fine, but after several seconds persistent drop out glitches creep in. Going to a slightly larger buffer size of 3072 mostly eliminates the audio glitches, and seems to prevent complete buffer underflows. With this buffer size and two decks playing, the CPU is around 55%.
Performance Tweak 3 - Timed Loop (Ab)Use
NXG doesn’t have explicit Execution Systems (VIs running in different thread pools at different priorities), but one can produce a similar result using Timed Loops, by forcibly running sections of code on dedicated CPU cores. There are three main Execution Systems used by Dataflow DJ - time critical instrument I/O (audio output), above normal data acquisition (audio processing), and normal priority user interface (UI updates). If the while loops around each of these components are replaced with Timed Loops of different priorities and on different CPU cores, we can approximate LabVIEW 20xx’s Execution System.
NOTE: It’s not a good idea to use Timed Loops in this way. This should be considered a last resort.
First step is to replace the regular While Loops with Timed Loops. Simply right-click the while loop and select Replace with Timed Loop…
 |
|---|
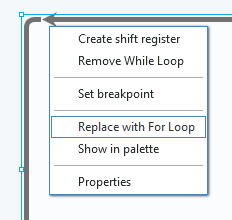
| Oh. |
…is how I would have done it in LabVIEW. Instead NXG only offers a replace with For Loop option (*sigh*). Replacing the While Loop requires removing it, creating a new Timed Loop, rewiring all the inputs and outputs, fixing up shift registers, and changing the stop terminal from Run infinitely to Stop if true.
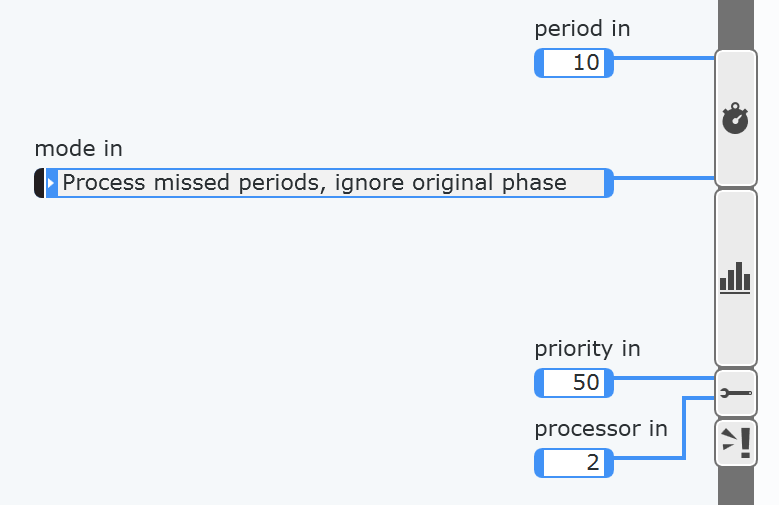
Using Timed Loops in this manner means the actual timing aspect of the loop is secondary. The project’s audio pipeline controls the timing via the audio device output, where each of the other loops in the system slaves from the output loop. For the new Timed Loops, the mode is set to Process missed periods, ignore original phase. We definitely want to process every period (else there will be audio glitches due to missing audio blocks), while the phase is ignored because the loop is being timed by the output device. The loop period doesn’t matter too much, just so long as it’s faster than the audio output device timing.
 |
|---|
| Timed Loop configuration for Audio Processing loop. |
After adding three Timed Loops with priorities similar to the old Execution System configuration, and each set to a dedicated CPU core, the result was better than expected. I was able to decrease the buffer size from 3072 to 2048 samples, and have the UI update at the full rate for that buffer size (44100/2048, or 21.5Hz). All of this while maintaining a CPU usage of about 45% with both decks playing. There is hope yet!
I did try the original 1024 sample buffer size, but was met with an immediate buffer underflow error before anything was even played. With more tuning to synchronize loop start times and using software timed triggers, playback with the original buffer size might be possible. That said, running in this Timed Loop configuration does have one major side effect - the UI becomes very unresponsive at times, with clicks not being registered for upwards of 10 seconds.
Failure To Launch
Running the code from source is great for debugging, but comes with a performance overhead. Unfortunately there was no way I could find to disable debugging on VIs in NXG. So the next best option was to build the project into an executable application. I created an Application in the project, moved Main.gvi from the My Computer library to the new application, then started a build. NXG had a long think, before declaring none of the libraries could be built.
Repeating the build was quicker, and this time all of the libraries and main application compiled successfully (without any source or project changes - just like good ol’ Application Builder). Running the built application was another matter, and wouldn’t start due to library linkage errors.
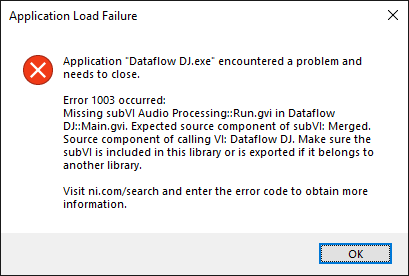 |
|---|
| The VI in question is exported and the library is present. |
In an attempt to fix the above error, I moved a few classes between libraries and namespaces and, well, that was a mistake. Dependency linkages broke completely, and no amount of reshuffling in the project would get things working again. Just then I happened to mouse over the magic wand icon in the error list and discovered it was a button for fixing dependency issues. Huzzah!
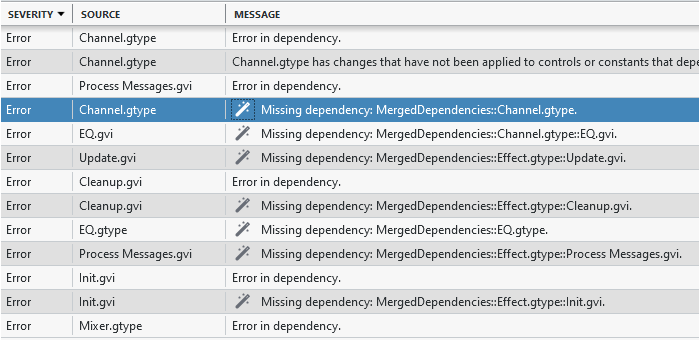 |
|---|
| That wand icon is a button. No, really. |
It didn’t do anything.
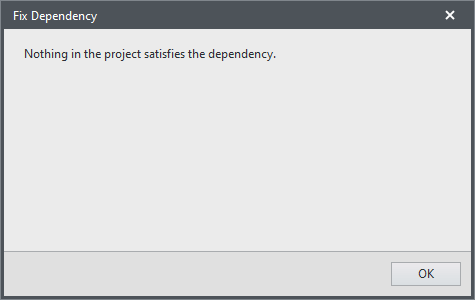 |
|---|
| The magic wand was just a stick >:( |
I didn’t persist with trying to get the build working, but was curious about all these extra libraries. TDMS? Color Picker? Pretty sure those libraries aren’t used in this project, but there doesn’t seem to be a way to check project dependencies to confirm. There is an option for calculating Package Dependencies but it didn’t return any results, presumably because libraries ain’t packages.
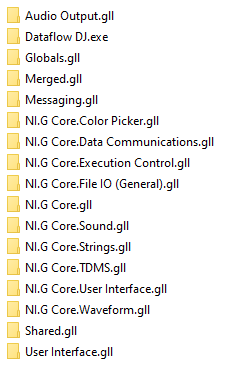 |
|---|
| Libraries! Libraries everywhere! |
Also the built executable and libraries are a bit over 30MB in size. Not massive by today’s app standards, but is huge compared to the original’s svelte 2.44MB compiled output.
I do wonder if some of the issues I ran into here were the result of the original project’s circular dependencies. Though if everything runs fine from source, I’d expect it should all compile and run correctly.
Debugging
Even with the added lag and choppy interface, I was having fun playing around with the end result. Then I ran into a curious issue with the keyboard shortcuts. I’d press the Q key to begin playback on Deck 1, and it’d fire the Key Down event and send the “Play” message to Deck 1. If I then clicked and held a button on the UI, pressed a key, then released the mouse button, subsequent key presses stopped working. Clicking the VI background of the DJ interface running in the panel container fixed things, by returning focus to the that VI. “Hah, another NXG bug!” I declared to myself. Time to hunt it down.
I placed some probes where the Key Down? event should be processed, and where the playback message should be received and acted on. It was then I discovered NXG’s debugging is… lacking.
First and foremost, where are the last update timestamps? Trying to see when events and messages are being sent and received (or if the code is even executing) without access to the last update time was surprisingly difficult. I discovered I can mouse over each probe in the Debugging window to get the timestamp, but then it’s only a tooltip for a single probe, and by the time the tooltip actually appears, that timestamp value is stale. And of course the timestamp in the tooltip doesn’t update while it’s visible.
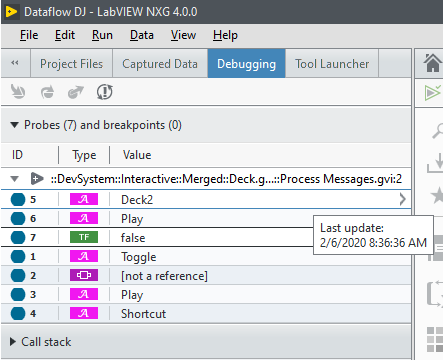 |
|---|
| A single stale timestamp. |
The other glaring debugging problem - there’s no way to see the probe values from multiple instances of a reentrant VI at the same time. Adding a probe to one instance will automatically add it to all other instances, while the Debugging pane only shows the probes of the currently viewed instance. Switching between VI instances switches the probe data visible in the Debugging pane. There’s also an issue where a probe placed in a reentrant VI won’t begin updating until switching to a different VI and back. This short video demonstrates the issues:
Now one can drag the VI instance out into another window so there are two NXG windows running, and it is possible to view debug info for multiple instances that way. Problem here is the debug info is now in two (or more) places. This also means that with all of NXG’s window dressing, I see less of my actual code. Makes me appreciate LabVIEW’s floating Probe Watch Window.
Despite the difficulty in debugging, I eventually tracked down the problem and found it was a bug in Dataflow DJ (more specifically a bug introduced when working around NXG’s dynamic event registration shortcomings). A second keyboard shortcut handler had been added to the top level VI, but the Key Down? event wasn’t being discarded, and so both the top level VI and panel container VI were processing the key press. Which meant pressing Q was starting and then immediately stopping playback. Once that Key Down? was discarded, keyboard shortcuts worked.
Keyboard Shortcut Detour 1
There’s an issue in LabVIEW 20xx where pressing F10 will not generate a Key Down event when another control is being used with the mouse. For example clicking and dragging a volume slider, then pressing F10 to activate the Deck 2 Flanger doesn’t work. What’s curious is all the other function keys work.
Anyway it seems this is no longer a problem in NXG. Yay!
Unicode!
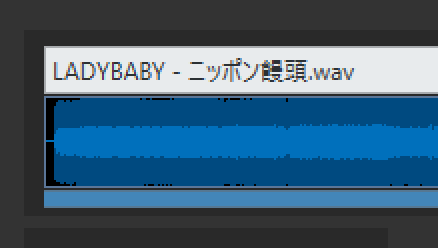
One NXG feature I had almost forgotten about was Unicode support and UTF-8 encoded strings. As a quick test I ran Dataflow DJ NXG and pointed it to a folder with a bunch of filenames containing Unicode, and up popped a correctly rendered list of non-English characters. Great! Now I can add a little LADYBABY - ニッポン饅頭 to my mixes! Wait, what’s that? The lvsound2 DLL wasn’t updated to support Unicode? Ah well, I’ll do it myself.
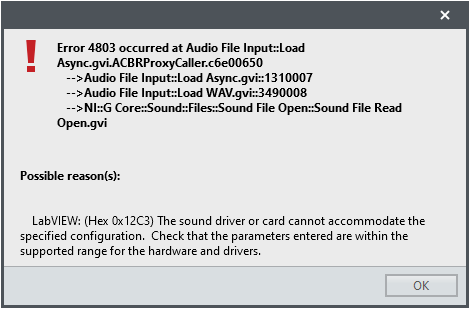 |
|---|
| *Slams counter* No Unicode WAVs for you! |
I loaded up the audio decoder DLL from the latest version of Dataflow DJ, which uses its own WAV decoder separate to LabVIEW’s WAV functions (courtesy of dr_wav). Now I haven’t done a lot with Unicode strings in C/C++, so was winging it a bit here. Windows’ Unicode support uses UTF-16 LE (little endian) encoded strings which are of the type wchar_t, which is a 16-bit wide character. Most Win32 file APIs have a wide variant which accepts these string types. So the simplest solution was to replace any file opening functions in the DLL with their wide counterpart, and update the exported DLL functions to use wchar_t* string paths rather than char* string paths.
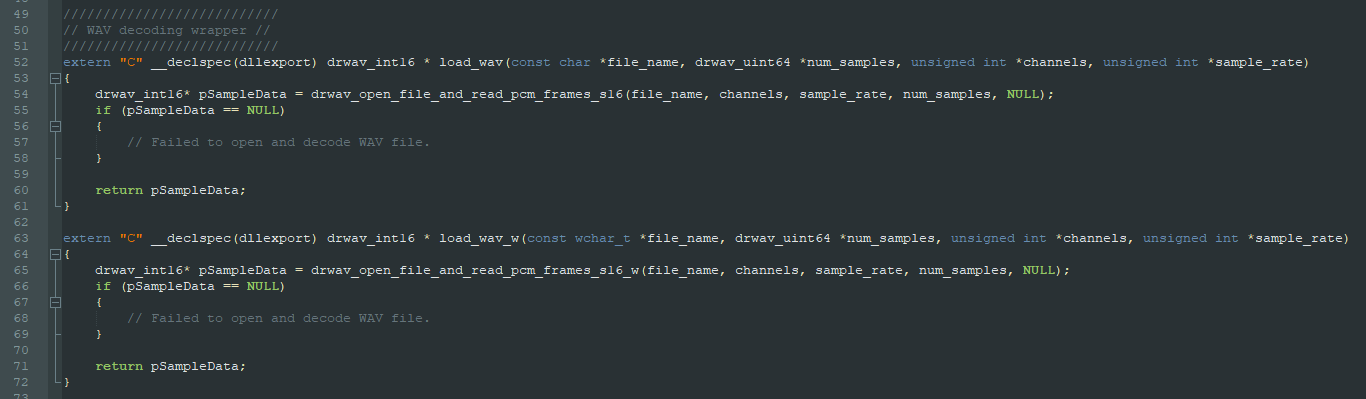 |
|---|
| char* and wchar_t* WAV variants. |
Back in LabVIEW NXG the DLL function parameters were updated by replacing string parameters with an array of U16s. When calling the function the file path is converted to a string. It is then passed through NXG’s String to Byte Array which includes an option to output a U8 byte array with a UTF-16 encoding (so every pair of array elements comprises a single character). This is fine, though the byte order is big endian (LabVIEW’s native endianness) and Windows needs little endian. After a type cast from a U8 array to a U16 array and some byte swapping, the array is now in a wchar_t*, UTF-16 LE compatible representation ready for the underlying Windows APIs. Passing this array to the updated DLL works, and audio files with Unicode filenames are now supported.
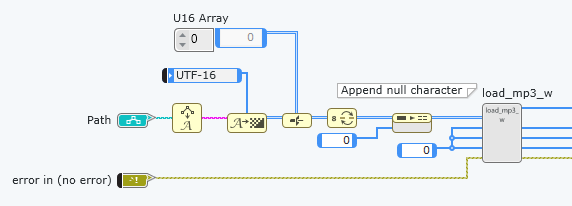 |
|---|
| UTF-8 to UTF-16 LE. |
Success!
 |
|---|
| Japanese bun! |
It would be useful if String to Byte Array offered both UTF-16 BE and UTF-16 LE output options, as I can see interfacing with Windows APIs being a common use case for UTF-16.
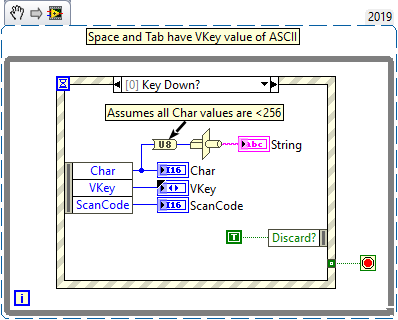
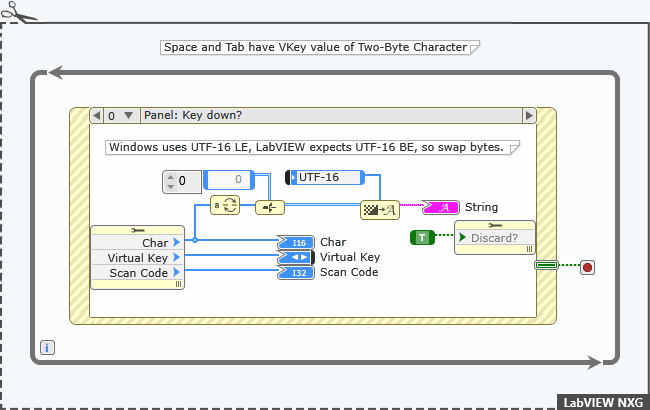
Keyboard Shortcut Detour 2
The Key Down events when pressing space or tab now report a VKey value of Two-Byte Character, whereas in LabVIEW they are both ASCII. I thought this might be Unicode related, but curiously all other keyboard inputs have a VKey value of ASCII. It’s not clear why space and tab are receiving special treatment. Not a problem per se, but something to be aware of.
Also worth pointing out is the Char value for a Key Down event appears to be encoded in UTF-16 LE format, presumably straight from a Windows API. As mentioned above, LabVIEW uses UTF-16 BE when converting between byte arrays and strings, so in the case of the Char value, its bytes first need to be swapped. If I hadn’t done that little refresher on Unicode when updating the DLLs, it would’ve taken a lot longer to realize the Char was a little endian byte order. Perhaps NXG should convert the Char value to big endian byte order before being returned in the event node (or even returned as a string?)
Snippets comparing the differences are below.
 |
|---|
| LabVIEW VKey returns ASCII for space. |
 |
|---|
| LabVIEW NXG VKey returns Two-Byte Character for space. |
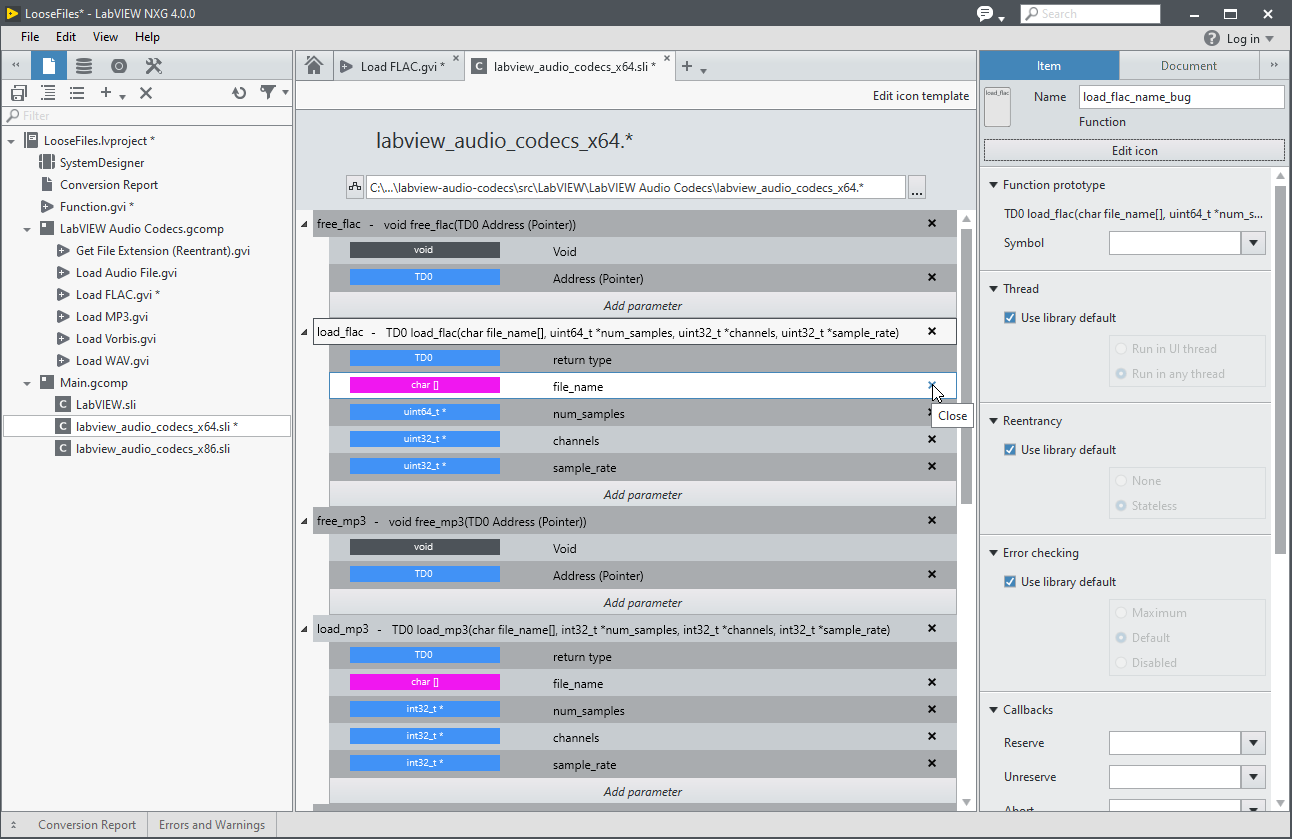
Shared Library Interfarce
Dealing with DLLs in NXG means using the Shared Library Interface (SLI). I have nothing nice to say about this interface, or the SLI experience in general. It works, but it is terrible.
 |
|---|
| SLI. Not even once. |
FYI there are four different bugs visible in this one screenshot. Yeah.
Thankfully I didn’t have to spend too much time with the SLI. It was easily the worst part of this project conversion experience.
The End Result
Here’s the converted Dataflow DJ in action!
Final Thought
All said and done, was it worth the effort? As an academic exercise, yes. The result isn’t spectacular, but it mostly works. I’m much more familiar with what LabVIEW NXG is capable of, but more importantly what it isn’t yet capabable of. I’ll definitely keep this project around to test the performance of future LabVIEW NXG versions.
Beyond this exercise, do I have a need for LabVIEW NXG? No. Or at least not for a long while. It offers very little that LabVIEW 20xx does’t already do (the big exception being webVIs). The one NXG feature I do like is how snappy LabVIEW feels after using it!
I really wanted to highlight more good bits during this process, but the truth is they just weren’t there. There was no “That’s why I need to use NXG!” moment which I was hoping to find. The latest LabVIEW NXG roadmap has a few promising features slated for the next release, so it’ll be interesting to test this project again with NXG 5.0.
And so the experiment ends here. Thanks for reading.